
Richmond Marathon Performance Trends (2020–2025)
Six-year dataset on Richmond Marathon performance, with interactive charts on participation, finish times, Boston qualifiers, and pacing patterns.

The Richmond Marathon, organized by Sports Backers, has been a staple of the Richmond running community for 48 years! We organized publicly available results data from the Richmond Marathon from 2020 through 2025 to take a closer look at participation and runner performance for America’s Friendliest Marathon.
Who Runs the Race? #
Over 21,000 runners have participated in the full marathon since 2020. The 2020 race was particularly small due to the COVID-19 pandemic, but participation has steadily risen since.
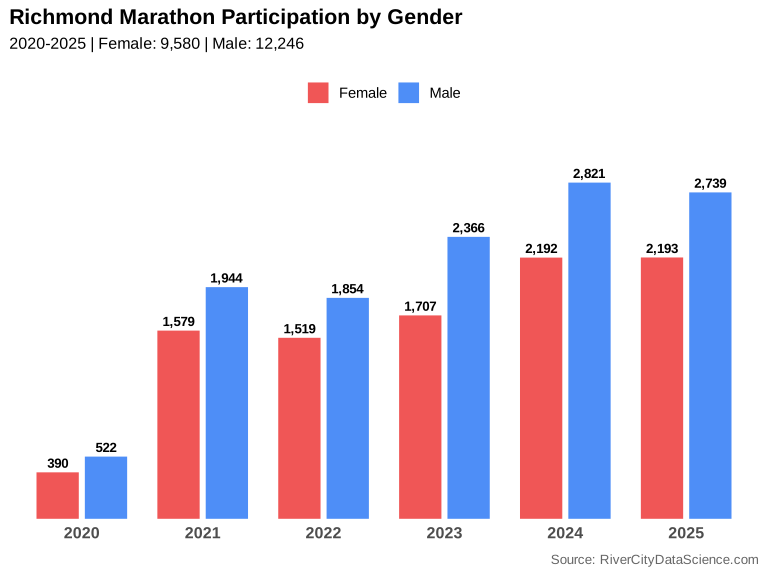
Men have much higher rates of participation than women overall, but we looked closer at age categories to see if the gender gap differs across generations.
Female Participation Trends by Age Group
Percentage of female runners in each age category, 2020-2025
This chart above tracks female participation percentage within each age group over time. In 2020 women were in the majority for the 35-44 age group, but recently, in the youngest category, female participation has hovered near 50% in 2024 and 2025. It will be interesting to see if this trend continues!
Overall, male participation exceeded female participation in every other age category and year. The pattern was most pronounced in the 55+ category, where males have remained steadily at 64-70% since 2020.
Finish Time Distribution #
How fast do Richmond Marathon runners finish? The overall median finish time ranges from a low of 4:40 in 2020 to a high of 4:12 in 2023. However, there is a lot of variation!
The interactive histogram below lets you explore the finishing time data from 2020 through 2025. Median times are calculated based on the selection at the top of the plot. Selecting an age/sex category will show the relevant Boston Marathon qualifying times (BQ).
Richmond Marathon Finish Time Distribution
Interactive histogram showing finish times with median and Boston Qualifying standards
The Richmond Marathon is known as a top Boston Qualifier, and indeed runners are showing up to qualify! Based on our data, 26% of runners ran qualifying times for the Boston Marathon in 2025, up from only 16% in 2020. The all-time high qualifying percentage was 29%(!) in 2023.
The Coveted Negative Split #
Do runners go out too fast and then fall off pace? A negative split refers to a time that is faster in the second half of the race than the first half, and is regarded as a race well executed. What does our data show?
The vast majority of runners (over 78% overall in 2025) positive-split the race, including many competitive finishers. Only 6.5% overall ran negative splits. Of those that ran Boston Qualifying times (BQ), the rate of positive split was much lower, at 41.3%, while the negative split rate was over double the overall rate 15.3%! Competitive runners display much more balanced times in Richmond.
In the interactive plot below, positive splits are shown in red and above the “even pace” line of equality. Even splits are yellow and negative splits are green.
Click the Show BQ Only toggle to highlight the splits of runners who ran Boston Qualifying times for their respective sex and age categories each year. Note that while the stats are calculated on the entire dataset, due to size constraints the plot only a sample of ~5,000 split times from 2021-2025 (no split times were available for 2020).
Marathon Pacing Analysis: First vs Second Half
Sample of ~5,000 split times (2021-2025). Toggle to highlight Boston Qualifiers
Wrap Up #
The Richmond Marathon is living up to its reputation—participation is growing, runners are getting faster, and the course keeps delivering Boston Qualifiers.
Want more analyses like this? We’ll be exploring additional races and training patterns soon. Interested in a deep dive of your community’s race or want to talk about a project? Get in touch or email us!
Data & Methodology #
All data is sourced from the Richmond Marathon race results (2020-2025). We cleaned and standardized finishing and split times across years and harmonized age/sex categories for comparability. The dataset includes:
- 21,826 total race finishes
- 6 years of data (2020-2025)
- Sex and age group distribution
Technical notes: Visualizations built with D3.js. We created simplified/consolidated age groups for clarity: Under 25, 25-34, 35-44, 45-54, 55+. These groups don’t necessarily match up to The Richmond Marathon’s official age groups or the Boston Marathon’s categories.